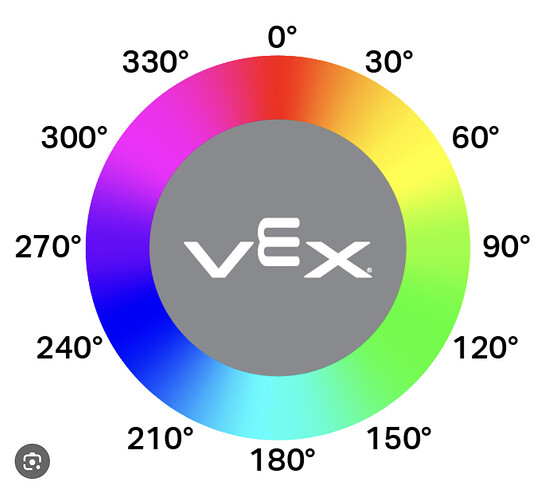
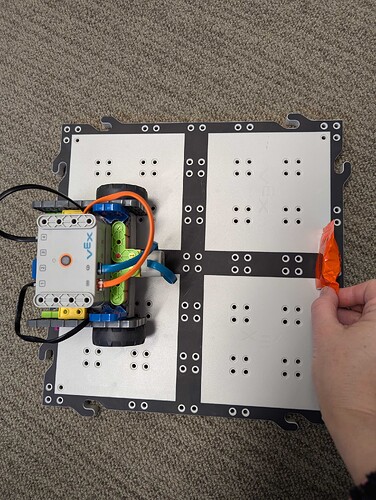
I realize this is super last minute, but if you are looking for a very quick and easy way to incorporate some CS with VEX GO into your Halloween festivities, here’s an easy idea for you. Build the VEX GO Code Base 2.0 Eye Forward, and use the Eye Sensor to collect hue value data for different kinds of Halloween candy! Then use your data to create a graph with the Hue Value chart.
Reproduce the GO Hue Value Chart by projecting it, or making a poster version.
Build this simple project in VEXcode GO:
Give each student a different kind of wrapped mini candy.
Place your robot on a GO Field Tile and have students hold the candy at a specific distance from the robot as shown, to make the data collection as accurate as possible.
Once students have determined the reported hue value for their piece of candy, have them tape it to the hue value chart in the correct location, and also have them record the number the hue value number somewhere so they can remember it.
Once you have finished attaching candy to your hue value chart, you can have a discussion with students about the data they collected. Were the hue values reported what the students expected? Why or why not? What factors might influence the way the sensor reports data about the candy?
This is a great opportunity to talk about how the Eye Sensor works, as well as how the robot perceives its environment!
For more information about how the VEX GO Eye Sensor works, refer to the Unit Overview section of the Data Detectives: Bridge Challenge STEM Lab!
There are probably dozens of ways to expand on this activity - if you think of some, post them here! And have a great Halloween.


