Thank you!!
Thank you so much Alaina! Do you have any for ideas/suggestions for the following standard: Relate the choice of measures of center and variability to the shape of the data distribution and the context in which the data were gathered?
This would work really well alongside the navigate the maze and data collection activity! For this standard, students are asked to choose what the most reliable measure would be between mean, median, and mode and choosing this measure based on what data they are gathering. And then also explain why that choice is the most appropriate.
When talking about the shape of distribution, that also relates back to the choice of measures can be influenced by whether the data is symmetric, skewed (either positively or negatively), or has multiple peaks. For example:
- In a symmetric distribution, mean and median are usually similar and can be used interchangeably as measures of center.
- In a skewed distribution, where the data is more spread out on one side, the median might be a better measure of center because it is less affected by extreme values compared to the mean.
- In a distribution with multiple peaks, neither the mean nor the median might fully represent the central tendency, so a different measure or a combination of measures might be more appropriate.
To summarize, adding a question or two to the end of the activity related to the choice of mean, median, or mode would be help to meet that standard! And then the variability portion would be the same kind of question but related to range, variance, and standard deviation.
Thank you! The next standard is demonstrate an understanding of statistical variability by displaying, analyzing, and summarizing distributions. Would there be another activity/code you would suggest?
Hi @Danielle_McCoy, what about using the IQ The Claw Activity and having students time themselves to see how many pieces they can pick up with the Clawbot in one minute. Then they could combine the class data and display it in line plots, histograms, box and whisker plots, etc?
Thank you @Aimee_DeFoe and @AlainaHaws!
I’m circling back around and working on:
“Write and Evaluate Numerical Expressions involving whole-number exponents.”
What activities/block code would you suggest for this?
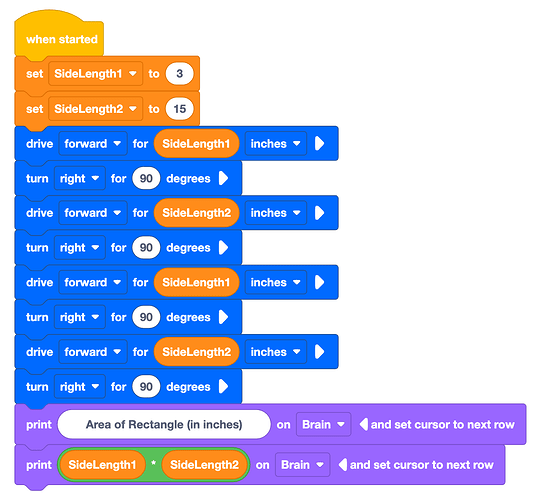
@AlainaHaws and @Jimmy_Lin, the students had an opportunity to try out the activity with the code before the school year ended for the standard (Determine the area of triangles and special quadrilaterals (i.e., square, rectangle, parallelogram, rhombus, and trapezoid) from our earlier thread above. They had a couple of questions that hopefully you can answer. This was the post from April 16th-19th.
-
What is the function of the distant sensor as it was not included in the example code?
-
As students were running the code, should it say: set sideLength2 to 15 instead of sideLength1 again?
Glad they were able to try it!
The function of distance sensor is in option 2 which is used to detect the length of a side and then students can run with the code to verify the accuracy of it.
You are absolutely correct and be sure to use consistency on the inches or mm!
Thanks for giving us feedbacks after testing with the students.
Thank you @Jimmy_Lin! Is it possible for the code to be updated to reflect set sideLength2 to 15?
Sure. Here it is. I’ve also attached the project file in case you want to update it further.
rectangle_area.iqblocks (9.2 KB)
@Aimee_DeFoe and @AlainaHaws!
I’m circling back around and working on:
“Write and Evaluate Numerical Expressions involving whole-number exponents.”
What activities/block code would you suggest for this?
Hi Danielle!
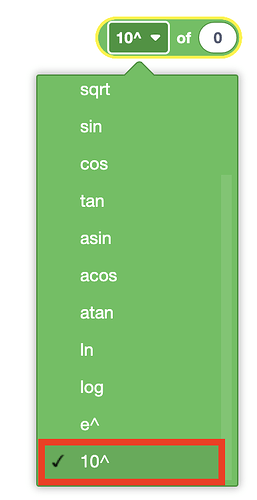
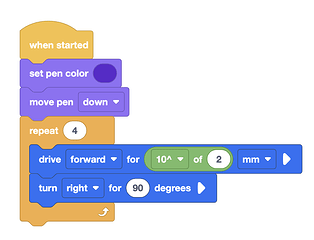
Why not use the operator blocks in VEXcode VR to create some exponent activities? You could use them on the Art Canvas or Art Canvas + Playgrounds to have the robot create visuals of the expressions that students write.
Good afternoon, I am looking for ideas to create a lesson plan, activity and code for the following standard.
“Write algebraic expressions from verbal descriptions.”
Any ideas would be greatly appreciated.
Hi Aimee,
Are you able to show me what a sample code might look like? Thank you
Hi Danielle,
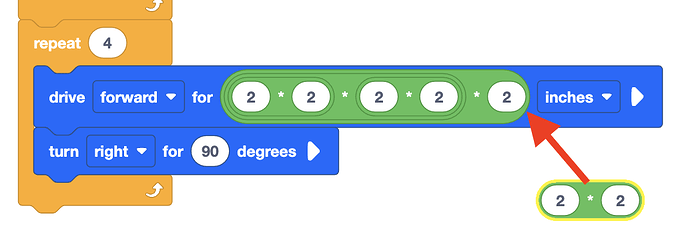
I was playing around too, and got this idea.
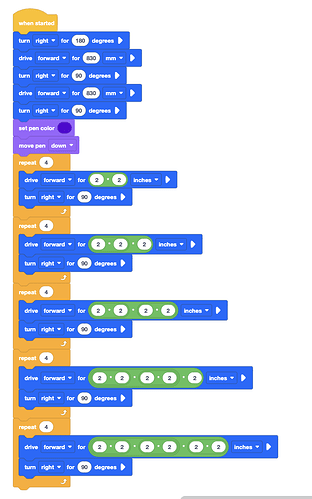
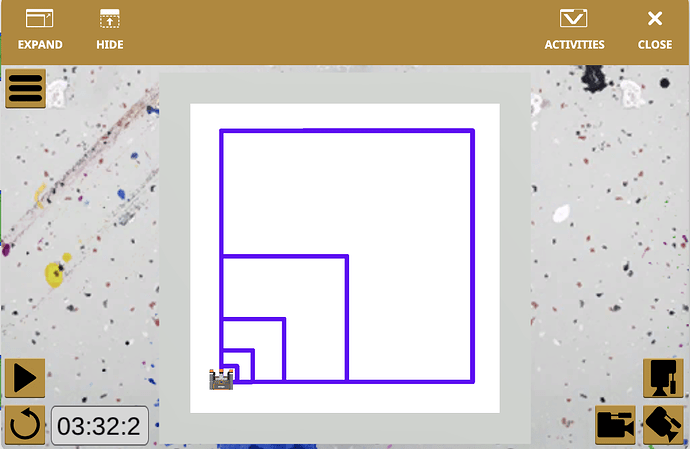
This code shows squares growing exponentially, allowing students to visualize what that means. They would have to nest the multiplication operators for each square like this:
And would end up with a design like this,
You could even have them print their design out and then use a ruler to draw the squares within the squares, and then write the equation for each one.
Let me know what you think about this idea! I can elaborate more if needed.
